SPY ETF Explained: The World’s Most Important Index Fund
A clear, data-driven breakdown of the world’s most important index fund.
Launched in 1993, SPY (SPDR S&P 500 ETF Trust) is the oldest, largest, and one of the most traded ETFs on the planet. It tracks the S&P 500 Index — the 500 largest public companies in the United States — and has become the benchmark for how “the market” performs.
What SPY Tracks
SPY follows the S&P 500 Index, representing about 80% of all U.S. stock market value.
This single ETF gives you exposure to:
The biggest US companies
All major sectors
A fully diversified equity portfolio
Instead of buying 500 individual stocks, you buy one ticker — SPY — and instantly own a slice of everything.

Top Holdings
SPY is market-cap weighted, which means the largest companies dominate the index.
Typical top holdings include:
Apple
Microsoft
Amazon
NVIDIA
Alphabet (Google)
Meta Platforms
Tesla
These companies often make up 25–30% of the ETF, even though the index includes 500 companies.

Fees and Costs
SPY’s expense ratio is 0.09% — incredibly low.
That means:
For every $10,000 invested
You pay $9 a year in fund fees
Competitors VOO and IVV are even cheaper (0.03% and 0.03%) but SPY remains the trading favorite.
Performance Overview
SPY’s performance mirrors the S&P 500:
Long-term annual returns: ~9–10%
Strongest decades: 1990s, 2010s
Worst periods: Dot-com crash, 2008, 2022 bear market
It’s not a high-risk, high-reward ETF — it is the market.

| Metric | Value |
| Mean Yearly Return | 9.68% |
| Annualized Return | 10.60% |
| Annualized Volatility | 18.69% |
| Sharpe Ratio | 0.567 |
| Sortino Ratio | 0.725 |
| Calmar Ratio | 0.188 |
| Max Drawdown | -56.47% |
| Stability Rate | 72.73% |
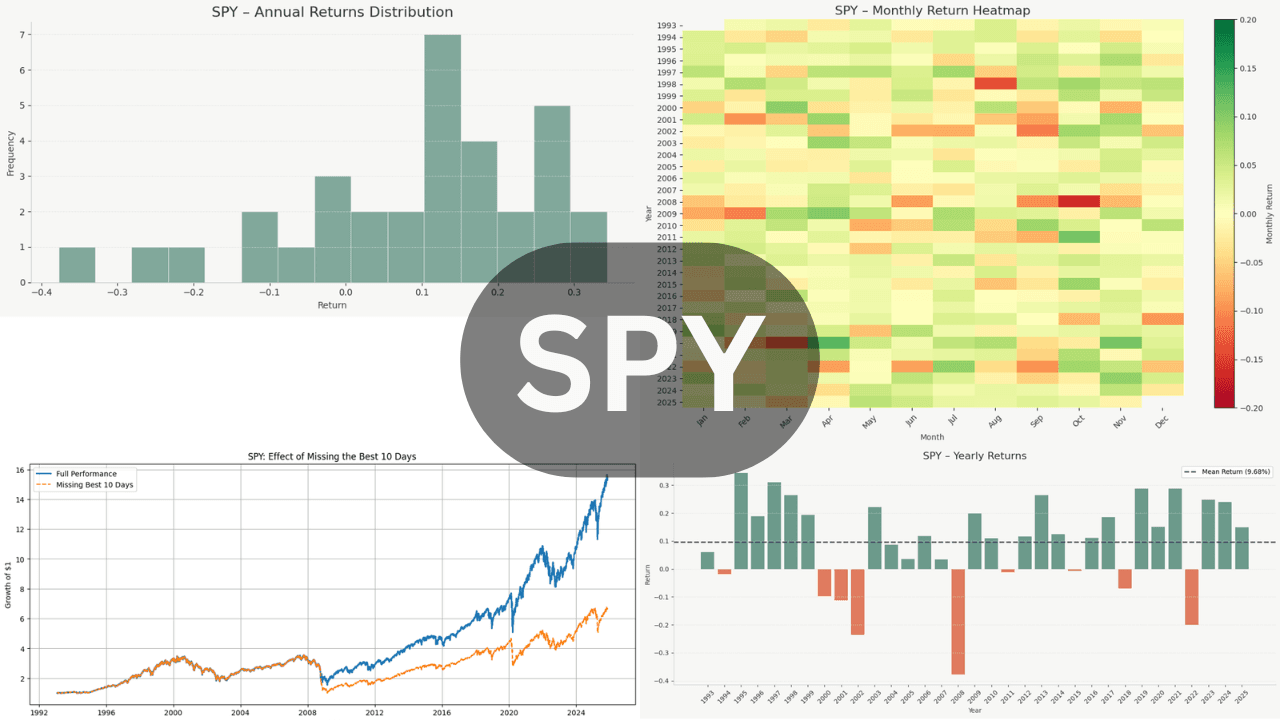
Yearly Returns Bar Chart

This chart shows SPY’s annual returns year-by-year. Positive years are highlighted in green and negative years in coral. The dashed line represents the average yearly return across the entire dataset, helping you see which years were above or below long-term expectations.
Monthly Return Heatmap

This heatmap displays SPY’s monthly returns across all available years. Green shades represent positive performance, while red shades indicate negative months. It helps identify seasonal patterns, strong or weak years, and cluster periods of gains or losses.
Daily Return Distribution Boxplot (by Year)

This boxplot illustrates how SPY’s daily returns were distributed each year. It highlights yearly volatility, the spread of returns, and how market behavior changes across different periods.
Annual Returns Histogram

This histogram summarizes SPY’s annual performance over time. It clearly separates good vs. bad years and highlights the long-term upward drift of equity markets.
Monthly Returns Histogram

This chart shows the distribution of monthly returns. It reveals more pronounced positive skew, typical of long-term equity performance.
Weekly Returns Histogram

This histogram visualizes SPY’s weekly returns. It smooths the daily noise and highlights broader market swings occurring over multi-day periods.
Daily Returns Histogram

This histogram shows the distribution of SPY’s daily returns. Most values cluster near zero, with occasional fat-tail events that reflect market shocks.
Rolling Annualized Volatility

This chart shows SPY’s annualized volatility using a rolling 252-day window. It highlights periods of heightened uncertainty or stress (higher volatility) versus calmer, more stable market environments.
Effect of Missing the Best 10 Days

This chart compares the growth of $1 invested in SPY versus the same investment with the 10 best days removed. The dramatic divergence demonstrates how missing just a handful of strong days can significantly reduce long-term returns.
SPY Drawdown Chart — Declines From All-Time Highs Over Time

This chart shows every decline in SPY from its rolling all-time high. Each dip represents a period when the ETF traded below its previous peak, highlighting the depth and duration of past market drawdowns. Large drops correspond to major market crises, while smaller, frequent pullbacks are part of normal market behavior. Understanding these cycles helps investors set realistic expectations for volatility and long-term performance.
Dividend Yield
SPY pays quarterly dividends with a yield typically around 1.3–1.6%.
Dividends automatically reflect the underlying companies’ payouts.
Final Thoughts: Why SPY Matters
SPY is more than an ETF — it is the benchmark for global markets.
When financial news says “the market is up,” they usually mean the S&P 500… and therefore SPY.
Studying SPY helps you understand:
How stock markets behave
Why diversification matters
How large companies drive returns
How the US economy evolves
For beginners, SPY is the simplest expression of long-term market investing.
For experts, it’s the world’s most important market instrument.
This is why SPY deserves to be the very first topic on ETFsExplained.com.